Supply chain automation is funded like a factory, which is fixed, static, and amortised over a decade. But infrastructure volatility has turned logistics into a trading floor where optionality is the only hedge. This article advances the kinetic balance sheet framework by introducing the Volatility‑Adaptive Automation Portfolio (VAAP). Using a forward‑looking volatility index (VIX‑SC) and a continuous flexibility score (Δ‑auto), CFOs can rebalance automation assets dynamically, just as a hedge fund manages delta exposure. The framework includes automation swaps which are derivative contracts that let companies flex robotic capacity by plus/minus 300% on short notice. Volatility becomes a priced, hedgeable variable, not a budget‑breaker.
Introduction
Imagine walking into a hedge fund’s trading desk and watching the manager commit $12 million to a single, illiquid asset with a 10‑year lock‑up period and zero ability to adjust position as market conditions change. You would call that reckless, perhaps even foolish. Yet that is precisely how most CFOs fund supply chain automation today.
A $12 million automated storage and retrieval system (AS/RS). A fixed network of conveyors bolted to a warehouse floor. A multi‑year robotics‑as‑a‑service contract with no flexibility on volume. Each of these decisions is evaluated using the same tools i.e., discounted cash flow, internal rate of return, net present value (Manzoor, 2026). The models produce neat, reassuring numbers. And then reality intervenes. A new trade corridor opens 50 miles away. A port shifts its primary berth. A regulatory change reroutes half the region’s freight. The infrastructure upon which that gleaming automation depended no longer serves you. Your fixed asset becomes a stranded asset (Manzoor & Malhotra, 2026).
This is not a Black Swan event. It is the ordinary weather of 21st‑century logistics. The GEP Global Supply Chain Volatility Index, produced with S&P Global and covering roughly 27,000 businesses, stood at 0.57 globally in April 2026, firmly in stretched territory with Asia at 1.16, indicating significant capacity strain (GEP, 2026). McKinsey estimates that supply chain disruptions can erode up to 45% of one year’s EBITDA over a decade (GTR, 2025). And yet the financial models used to approve automation projects have not changed in forty years.
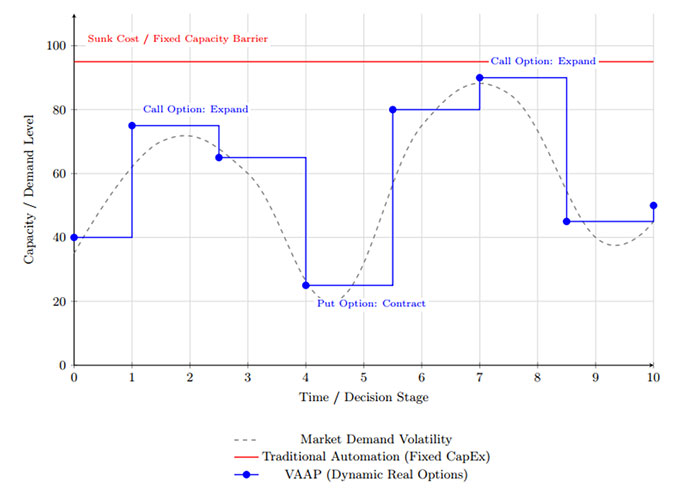
What if CFOs approached supply chain automation the way a hedge fund approaches a portfolio? Not as a collection of static assets to be depreciated, but as a dynamic set of positions to be rebalanced continuously against a measurable index of volatility. Not with a single ROI calculation, but with a delta score that changes every quarter. Not with a binary go/no‑go decision, but with a range of option‑like contracts or automation swaps that let you increase or decrease robotic capacity on two weeks’ notice at a pre‑agreed price.
This is not a metaphor. It is a practical framework called the Volatility‑Adaptive Automation Portfolio (VAAP). It rests on three pillars. First, a forward‑looking volatility index for each logistics node, a continuous flexibility score (Δ‑auto) for every automation asset, and a dynamic rebalancing rule that forces the portfolio to become more flexible when volatility rises—the opposite of what most companies instinctively do.
The conversation in the boardroom needs to change. The question is no longer “What is the ROI of this automation project?” It is “How does this investment change our ability to adapt when the infrastructure beneath us shifts?” Until CFOs can answer that question with confidence, the hesitation will remain. This article shows you how.
Why the spreadsheet lies
The problem is not that CFOs are poor financial analysts. The problem is that the analytical tools at their disposal were designed for a world that no longer exists. Traditional capital budgeting assumes a static environment. Discounted cash flow models project steady‑state operations into the indefinite future. Hurdle rates are set at the enterprise level, treating a warehouse in a geopolitically stable region the same as one in a rapidly shifting logistics corridor. And the concept of flexibility does not appear anywhere in the calculation.
This matters because not all automation investments carry the same risk profile. A fully automated facility with fixed conveyors and proprietary software is a very different asset from a fleet of autonomous mobile robots operating on a robotics‑as‑a‑service contract. Traditional finance treats them identically. It ignores the vast difference in their resale value, their re-deployability, and their vulnerability to infrastructure shocks.
Related: The kinetic balance sheet: Why supply chain automation is a CFO’s problem
A growing body of academic research is beginning to address this blind spot. In 2026, recent working papers demonstrate that treating resilience actions as sequential real options enables managers to evaluate investments based on probability‑weighted performance outcomes rather than worst‑case scenarios (Trepte et al. 2025). Critically, the authors found that option‑based sequencing creates probability‑weighted resilience outcomes 3.6 times lower in expected loss than worst‑case analysis. This gap between worst‑case and plausible outcomes, they argue, explains the boom‑bust cycles in which organizations overinvest based upon improbable tail events, then retrench when projected benefits fail to materialize.
This is not merely an academic distinction. It is a practical framework for rethinking how supply chain automation appears on the balance sheet.
Introducing the Volatility‑Adaptive Automation Portfolio (VAAP)
The VAAP framework rests on three operational pillars, each designed to be implemented by a finance team without exotic software or consultants. See Figure 1.
Pillar 1: The Volatility Index (VIX‑SC)
For each major logistics node (warehouse, port gateway, cross‑dock), calculate a forward‑looking volatility score on a 0–100 scale. This VIX‑SC combines three inputs:
- Internal forecast error: The standard deviation of your own demand and lead‑time forecasts over the past 12 months.
- External infrastructure risk: Public data on port congestion, government project delays (scraped from procurement portals), and political risk ratings.
- Market‑implied volatility: The GEP Global Supply Chain Volatility Index for your region.
The result is a single monthly number. A VIX‑SC of 20 signals a calm environment. A score of 80 signals severe strain.
Pillar 2: The Flexibility Score (Δ‑auto)
Every automation asset existing or proposed receives a Δ‑auto score from 0 (fully rigid) to 1 (fully flexible). Table 1 provides a simple, finance‑friendly calculation.
Table 1: Δ‑auto calculation checklist
|
Question |
Rigid (0) |
Flexible (1) |
|
Can the asset be relocated within 30 days? |
No |
Yes |
|
Does the asset have a secondary market value >50% of purchase price? |
No |
Yes |
|
Can the asset accept real‑time data from public infrastructure feeds? |
No |
Yes |
|
Is the contract duration less than 2 years? |
No |
Yes |
|
Is the asset’s design modular with hot‑swappable components? |
No |
Yes |
Δ‑auto = (Number of “Yes” answers) / 5
Source: Author’s analysis based on industry asset classification and real‑options valuation principles.
For a fleet of autonomous mobile robots on a month‑to‑month RaaS contract, Δ‑auto will be 1.0. For a custom‑designed, bolted‑down conveyor system with proprietary software and a 10‑year lease, Δ‑auto will be 0.0.
Pillar 3: The Dynamic Rebalancing Rule
Here is the counterintuitive heart of VAAP. The target portfolio flexibility is set directly by the volatility index:
Target Δ‑auto (portfolio) = VIX‑SC / 100
When volatility is low (VIX‑SC = 20), you target 20% flexible assets and 80% rigid, efficient assets. When volatility is high (VIX‑SC = 80), you target 80% flexible assets and only 20% rigid assets.
Table 2 shows how this works using real April 2026 data from the GEP Index.
Table 2: Target Portfolio Flexibility by Volatility Environment (April 2026 Data)
|
Volatility Environment |
VIX-SC (GEP scale, 0–2) |
Calculation |
Target Δ-auto |
Implication |
|
Low (Calm) |
0.20 |
min(0.20, 1.0) = 0.20 |
0.20 |
Tilt toward rigid assets (conveyors, fixed ASRS) to maximize efficiency. |
|
Moderate (Stretched) |
0.57 (Global, Apr '26) |
min(0.57, 1.0) = 0.57 |
0.57 |
Balanced mix; hedge against further volatility while maintaining some efficiency. |
|
High (Crisis) |
1.16 (Asia, Apr '26) |
min(1.16, 1.0) = 1.0 |
1.00 |
Maximum flexibility; prioritize AMRs on RaaS, pop-up micro-fulfillment, and automation swaps. |
If your actual portfolio Δ‑auto deviates from the target by more than plus/minus 0.15, you rebalance. This means selling rigid assets on secondary markets, converting fixed leases to flexible terms, or acquiring spot capacity through automation swaps.
Figure 1
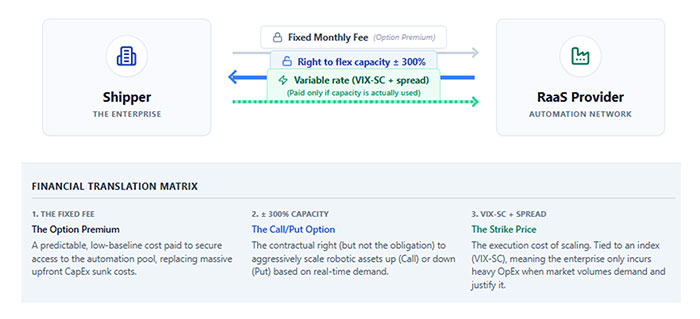
The financial innovation: Automation swaps
An automation swap is a contract between a shipper and a robotics‑as‑a‑service provider. The shipper pays a fixed monthly fee in exchange for the right to increase or decrease robotic capacity by up to 300% with two weeks’ notice, at a pre‑agreed variable rate. This is not a lease. It is a derivative. The provider takes the volume risk, and the shipper pays a premium—the “swap spread” priced—based on the VIX‑SC. For a CFO, this turns supply chain volatility from a budget‑breaker into a traded risk with a transparent market price. You can now hedge your warehouse automation exposure just as you hedge fuel or foreign exchange. See Figure 2. The structural mechanics of a Volatility-Adaptive Automation swap. The shipper secures dynamic capacity by paying a baseline option premium, retaining the right to scale capacity with execution costs tied to a Supply Chain Volatility Index (VIX-SC).
Figure 2
Implementing VAAP: A four‑step roadmap for CFOs
The framework does not require a system overhaul. It requires a change in capital allocation discipline.
|
Step |
Action |
Owner |
Key Deliverable |
|
1 |
Calculate VIX‑SC for top 5 logistics nodes using internal forecast error + external public data. |
Chief Data Officer / Treasury |
Monthly volatility scorecard. |
|
2 |
Inventory all automation assets and compute Δ‑auto using Table 1. |
Supply Chain Finance |
Asset flexibility ledger. |
|
3 |
Set target Δ‑auto = VIX‑SC / 100. If actual Δ deviates >±0.15, create a rebalancing plan. |
CFO |
Rebalancing memo for investment committee. |
|
4 |
For new investments, require swap‑embedded contracts for any asset with Δ < 0.5. |
Procurement + Treasury |
RFP language mandating flexibility clauses. |
Why this matters now
Recent surveys highlight a systemic barrier. A 2025 global study of 350 CFOs found that only 15% view supply chain as a priority knowledge area, creating systematic obstacles to technology investment approval. This disconnect is compounded by the fact that 67% of CFOs report current digital investments underperform expectations, making supply chain automation proposals face increased scepticism (MHI, 2025). VAAP directly addresses this credibility gap by providing a common language volatility, delta, optionality that resonates in the finance suite.
The companies that thrive in the coming decade will not necessarily be those with the fastest automation or the lowest unit costs. They will be those whose CFOs have learned to see flexibility as a financial asset, optionality as a hedge, and volatility not as a threat to be managed but as a variable to be priced.
The conversation in the boardroom needs to change. The question is no longer “What is the ROI of this automation project?” It is “How does this investment change our ability to adapt when the infrastructure beneath us shifts?”
Until CFOs can answer that question with confidence, the hesitation will remain and the spreadsheet will continue to lie.
References
Manzoor, R. (2026), The kinetic balance sheet: Why supply chain automation is a CFO’s problem”, Supply Chain Management Review. https://www.scmr.com/article/the-kinetic-balance-sheet-why-supply-chain-automation-is-a-cfos-problem
Manzoor, R. and Malhotra, G. (2026), When the State Rewires Logistics: A Framework for Automation Strategy in Infrastructure-Shifting Environments, California Management Review (Insights), https://cmr.berkeley.edu/assets/documents/pdf/2026-03-when-the-state-rewires-logistics-a-framework-for-automation-strategy-in-infrastructure-shifting-environments.pdf
GEP (2026). GEP Global Supply Chain Volatility Index. https://www.gep.com/knowledge-bank/global-supply-chain-volatility-index
Trepte, K., Klibi, W., Rice, J. B., & Ducq, Y. (2026). Option-Based Framing and Valuation of Supply Chain Resilience Investments (Working Paper, hal‑05498741). https://hal.science/hal-05498741
GTR (2025). Supply Chains: From Just in Time to Just in Case.https://www.gtreview.com/magazine/the-supply-chain-issue-2025/supply-chains-from-just-in-time-to-just-in-case/
MHI (2025). New MHI and Deloitte Report Focuses on Orchestrating End-to-End Digital Supply Chain Solutions. https://www.mhi.org/content/2/2285545/new-mhi-and-deloitte-report-focuses-on-orchestrating-end-to-end-digital-supply-chain-solutions
SC
MR


More Warehouse Automation
- DHL Supply Chain bets on data foundations, robotics, and agentic AI to drive growth
- How industrial real estate decisions are shaping supply chain performance
- Your supply chain automation should trade like a hedge fund
- Why trust, flexibility, and execution now matter more than speed
- Modex 2026: Now & next
- More Warehouse Automation
What's Related in Warehouse Automation
 Explore
Topics
Business Management News
- CSCOs need plant leaders to close the manufacturing transformation gap
- AI is reshaping the last meter of delivery
- The Digital Supply Chain Imperative: From Visibility to Execution
- AI runs on compute; scaling it runs on logistics
- Wayfair executive to share lessons from building a tech-driven delivery network in NextGen Keynote
- Surging AI adoption doesn’t match mass layoff narrative
- More Business Management
Latest Business Management Resources

Subscribe

Supply Chain Management Review delivers the best industry content.

Editors’ Picks